Why do my campaign metrics differ across the Dashboard, Campaigns tab, Reports tab, and Prospects filter?
Last updated: September 23, 2026
It's common to notice differences in numbers when comparing metrics across different sections of the platform — such as the Dashboard, the Campaigns tab, the Reports tab, and the Prospects filter. This article explains why these discrepancies occur and how each section calculates its data.
How each section counts metrics
Campaign Metrics (Campaigns tab)
Campaign metrics count unique leads who performed an action. For example, if the same prospect clicks a link three times, the campaign records this as 1 click. Campaign metrics are the most reliable source for per-campaign performance data.
Activity Dashboard
The Dashboard logs every individual event. So those same three link clicks from one prospect would appear as 3 separate events. Additionally, the Dashboard only shows data within your selected date range and only includes active and inactive campaigns — archived or deleted campaigns are excluded.
Reports tab
The Reports tab records daily statistics historically. It covers a broader scope than the Dashboard and can include data from archived and deleted campaigns depending on your filters. Use the Filter section in the Reports tab and select a specific campaign to get the clearest view of your data.
Prospects filter
The Prospects tab with a status filter (e.g., "Leads") shows the current status of prospects. This will differ from Reports because:
A prospect marked as Lead and then changed to another status (e.g., Not Interested) will no longer appear in the Leads filter, but their earlier Lead activity is still counted historically in Reports.
A prospect marked as Lead or Customer on the same day is counted only once in the daily report. However, if the same prospect is marked on different days, the report count increases each time. This means the number of Leads and Customers in Reports will always be equal to or greater than the number shown in the Prospects filter.
The Prospects filter reflects your entire account history (all campaigns, including archived/deleted ones), while the Dashboard is limited to your selected date range and active/inactive campaigns only.
Email metrics: "Emails Sent" showing 0
You may notice that Emails Sent shows 0 in the Email Open Rate section, while the Email Bounce Rate section shows a non-zero sent count. This is expected behavior:
Email Open Rate → Emails Sent: Only counts emails for which open tracking data is available. If Track Emails Opened is disabled in your campaign settings, this value will remain 0 even if emails were sent.
Email Bounce Rate → Emails Sent: Based on actual email delivery records, so it reflects the true number of emails sent regardless of whether open tracking is enabled.
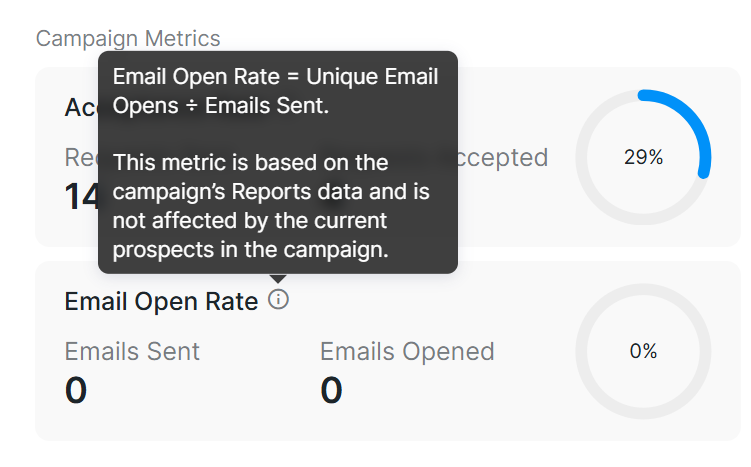
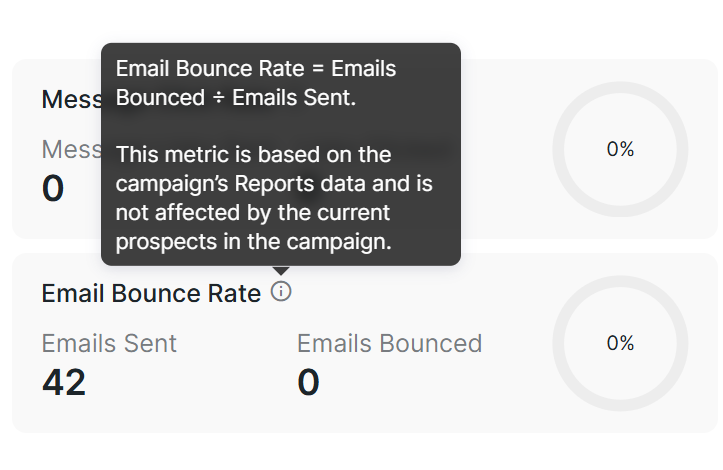
If you'd like to track email opens going forward, enable the Track Emails Opened toggle in your campaign settings. Note that this only applies to emails sent after the setting is enabled — it will not backfill tracking data for previously sent emails.

Unique vs. total clicks
Keep in mind the distinction between unique and total counts:
Campaign metrics count unique leads who performed an action (e.g., 1 click per lead, regardless of how many times they clicked).
Activity Dashboard logs every individual event (e.g., 3 clicks from the same lead = 3 events).
This is why "Messages Clicked" or "Links Clicked" in the Campaigns tab can appear higher than the number of messages sent — a single prospect can click multiple times.
Naming differences between Campaigns and Reports
Some metrics have slightly different names depending on where you view them. For example:
Accepted Requests (Campaigns tab) = accepted connection requests within a campaign step.
Accepted Invites (Reports tab) = accepted invitations recorded historically in daily statistics.
When in doubt, use the Filter section in the Reports tab and select the specific campaign you want to review for the clearest and most accurate data.
Which data source is most accurate?
For the most reliable and up-to-date campaign performance data, refer to the Campaign metrics view (within the individual campaign). The Reports tab provides accurate historical data, especially when filtered by a specific campaign.
Still seeing unexpected numbers?
If numbers still don't add up after reviewing the above, consider the following:
Check that your date range filter in the Dashboard matches the period you're comparing against.
Verify whether the campaign in question is active, inactive, archived, or deleted — this affects which sections include it.
Connection request withdrawals or campaigns with limits set to zero can result in lower-than-expected outreach numbers.
If you continue to experience issues, please reach out to our support team with screenshots of the specific metrics and sections you're comparing.